
티스토리 뷰
1. Grafana 설치파일 다운로드 및 설치
https://grafana.com/grafana/download
Download Grafana
Overview of how to download and install different versions of Grafana on different operating systems.
grafana.com
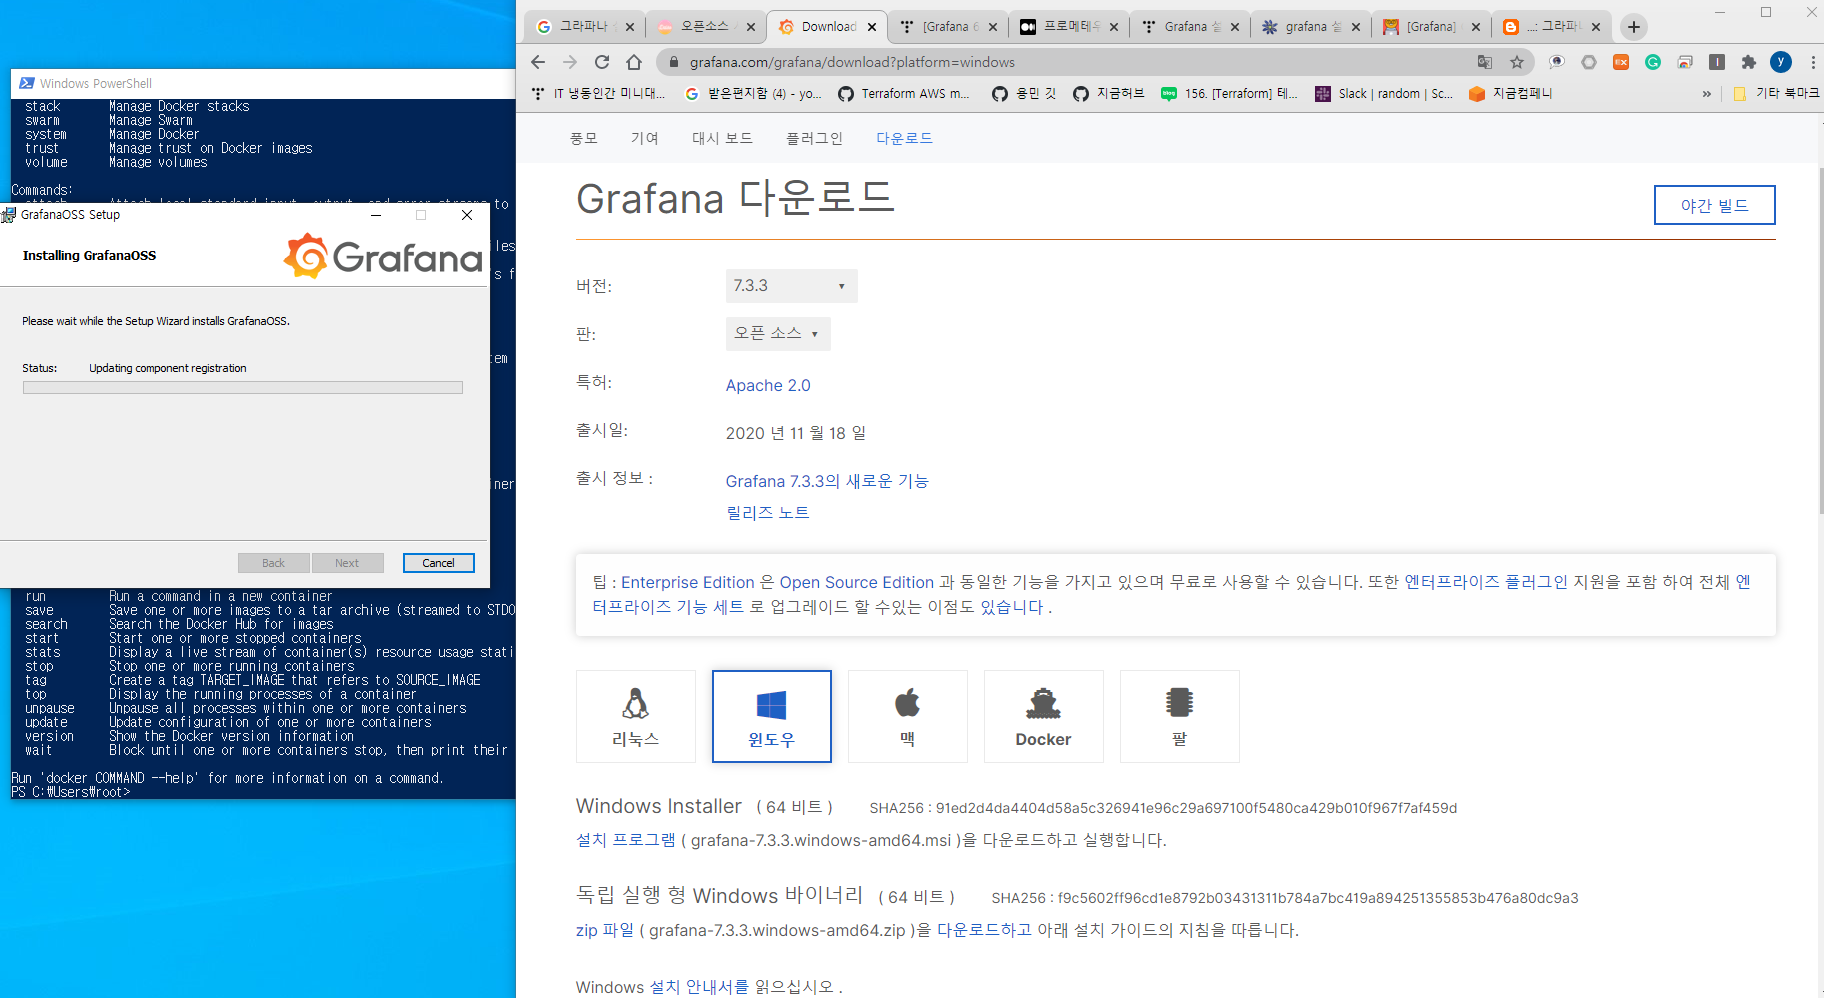
2. 윈도우 설치 =>Download the installer (grafana-7.3.3.windows-amd64.msi) and run it.
Windows Installer(64 Bit)SHA256: 91ed2d4da4404d58a5c326941e96c29a697100f5480ca429b010f967f7af459d
Download the installer (grafana-7.3.3.windows-amd64.msi) and run it.
3. 아래 Centos 설치
Red Hat, CentOS, RHEL, and Fedora(64 Bit)

$wget https://dl.grafana.com/oss/release/grafana-7.3.3-1.x86_64.rpm

$sudo yum install grafana-7.3.3-1.x86_64.rpm
서버에 접근(SSH)
wget https://dl.grafana.com/oss/release/grafana_6.5.2_amd64.deb

설치완료 후에는
service grafana-server start 명령어로 시작
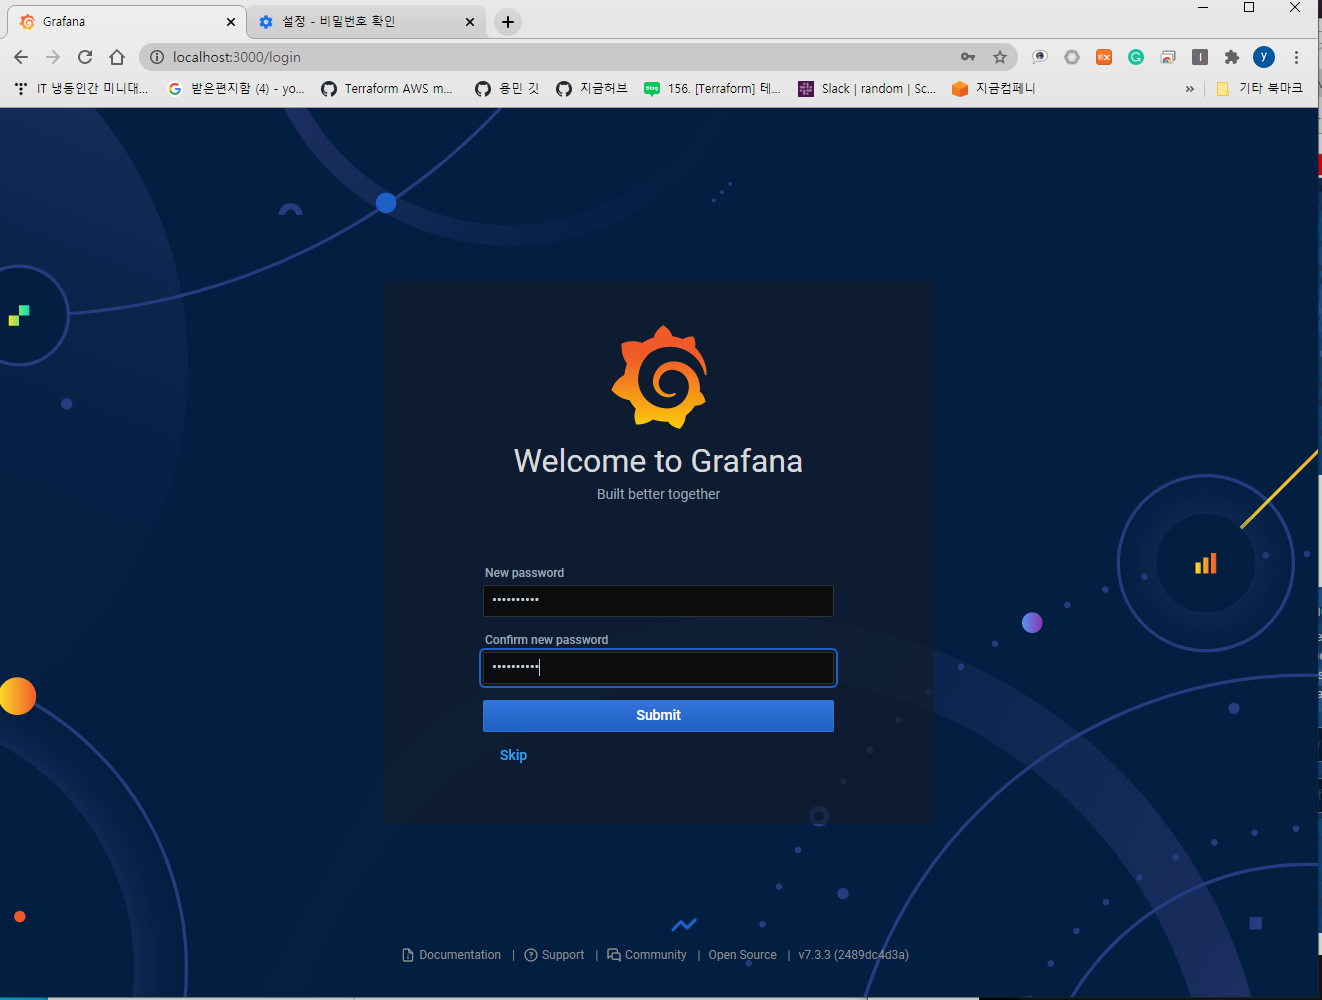
그라파나 시작

http://localhost:3000/login
시작후에는 웹 접속 되는 지 확인합니다.
putty 다운로드 : www.chiark.greenend.org.uk/~sgtatham/putty/latest.html
!!잠깐만요!!!!!!!!!! 잠시 터널링 하고 가실께요~~~~~~~~~


id와 pw는 admin / admin 최초 패스워드후 아래와 같이 신규 패스워드를 변경해봅니다.
튜토리얼-Ubuntu Linux에서 InfluxDB 설치
Ubuntu Linux에 InfluxDB 패키지를 다운로드하여 설치하십시오.
Copy to Clipboard
$mkdir /downloads
$cd /downloads
$wget https://dl.influxdata.com/influxdb/releases/influxdb_1.7.8_amd64.deb
$dpkg -i influxdb_1.7.8_amd64.deb
부팅하는 동안 InfluxDB 서비스가 자동으로 시작되도록 구성하십시오.
influxDB 서비스의 상태를 확인하십시오.
Copy to Clipboard
systemctl enable --now influxdb
systemctl status influxdb
● influxdb.service - InfluxDB is an open-source, distributed, time series database
   Loaded: loaded (/lib/systemd/system/influxdb.service; enabled; vendor preset: enabled)
   Active: active (running) since Mon 2019-09-23 23:11:01 UTC; 51min ago
     Docs: https://docs.influxdata.com/influxdb/
 Main PID: 2691 (influxd)
    Tasks: 8 (limit: 1152)
   CGroup: /system.slice/influxdb.service
           └─2691 /usr/bin/influxd -config /etc/influxdb/influxdb.conf

Sep 23 23:11:03 ip-172-31-41-29 influxd[2691]: ts=2019-09-23T23:11:03.469294Z lvl=info msg="Listening on HTTP" log_id=0I467dX0000 service=httpd addr=[::]:8086 https=false
Sep 23 23:11:03 ip-172-31-41-29 influxd[2691]: ts=2019-09-23T23:11:03.469418Z lvl=info msg="Starting retention policy enforcement service" log_id=0I467dX0000 service=retention check_interval=30m
Sep 23 23:11:03 ip-172-31-41-29 influxd[2691]: ts=2019-09-23T23:11:03.469569Z lvl=info msg="Listening for signals" log_id=0I467dX0000
Sep 23 23:11:03 ip-172-31-41-29 influxd[2691]: ts=2019-09-23T23:11:03.469839Z lvl=info msg="Storing statistics" log_id=0I467dX0000 service=monitor db_instance=_internal db_rp=monitor interval=10s
Sep 23 23:11:03 ip-172-31-41-29 influxd[2691]: ts=2019-09-23T23:11:03.470301Z lvl=info msg="Sending usage statistics to usage.influxdata.com" log_id=0I467dX0000
이제 다음 명령을 사용하여 InfluxDB 명령 행에 연결하십시오.
influx
Connected to http://localhost:8086 version 1.7.8
InfluxDB shell version: 1.7.8
> exit
축하합니다! Ubuntu Linux에서 influxDB 설치를 완료했습니다.
root@vagrant:/downloads# influx
Connected to http://localhost:8086 version 1.7.8
InfluxDB shell version: 1.7.8
> create database alicek106
> show databases;
name: databases
name
----
telegraf
_internal
alicek106
> create database tommypagy
> show databases;
name: databases
name
----
telegraf
_internal
alicek106
tommypagy
> use tommypagy
Using database tommypagy
> show measurements
> insert memory,host=server01,region=korea value=5.5
> show measurements
name: measurements
name
----
memory
> insert memory,host=server02,region=japan value=4.5
> show measurements
name: measurements
name
----
memory
> select * from memory
name: memory
time                host     region value
----                ----     ------ -----
1606269411201715016 server01 korea  5.5
1606269426753901594 server02 japan  4.5
> insert memory,host=server03,name=alicek106 value=6.5
> select * from memory
name: memory
time                host     name      region value
----                ----     ----      ------ -----
1606269411201715016 server01           korea  5.5
1606269426753901594 server02           japan  4.5
1606269478426519724 server03 alicek106        6.5
> insert memory,host=server03,name=tommypagy value=6.5
> select * from memory
name: memory
time                host     name      region value
----                ----     ----      ------ -----
1606269411201715016 server01           korea  5.5
1606269426753901594 server02           japan  4.5
1606269478426519724 server03 alicek106        6.5
1606269497032640410 server03 tommypagy        6.5
> show tag key
ERR: error parsing query: found EOF, expected EXACT, CARDINALITY at line 1, char 14
> show tag keys
name: memory
tagKey
------
host
name
region
> show field keys
name: memory
fieldKey fieldType
-------- ---------
value    float
>
튜토리얼-Ubuntu Linux에서 Telegraf 설치
SNMP 모니터링을 사용하려면 필요한 소프트웨어를 설치하십시오.
$apt-get install snmp snmp-mibs-downloadersnmp.conf라는 SNMP 구성 파일을 편집하십시오.
$vi /etc/snmp/snmp.conf구성하기 전에 원본 파일이 있습니다.
# As the snmp packages come without MIB files due to license reasons, loading
# of MIBs is disabled by default. If you added the MIBs you can reenable
# loading them by commenting out the following line.
mibs :
SNMP 클라이언트 구성을 완료했습니다.
Ubuntu Linux에 Telegraf 패키지를 다운로드하여 설치하십시오.
$mkdir /downloads
$cd /downloads
$wget https://dl.influxdata.com/telegraf/releases/telegraf_1.12.1-1_amd64.deb
$dpkg -i telegraf_1.12.1-1_amd64.deb
부팅 중에 Telegraf 서비스가 자동으로 시작되도록 구성하십시오.
Telegraf 서비스의 상태를 확인하십시오.
$systemctl enable --now telegraf
$systemctl status telegraf
다음은 Telegraf 서비스 상태의 예입니다.
● telegraf.service - The plugin-driven server agent for reporting metrics into InfluxDB
   Loaded: loaded (/lib/systemd/system/telegraf.service; enabled; vendor preset: enabled)
   Active: active (running) since Tue 2019-09-24 01:17:53 UTC; 3s ago
     Docs: https://github.com/influxdata/telegraf
 Main PID: 3020 (telegraf)
    Tasks: 7 (limit: 1152)
   CGroup: /system.slice/telegraf.service
           └─3020 /usr/bin/telegraf -config /etc/telegraf/telegraf.conf -config-directory /etc/telegraf/telegraf.d

Sep 24 01:17:53 ip-172-31-41-29 systemd[1]: Stopped The plugin-driven server agent for reporting metrics into InfluxDB.
Sep 24 01:17:53 ip-172-31-41-29 systemd[1]: Started The plugin-driven server agent for reporting metrics into InfluxDB.
Sep 24 01:17:53 ip-172-31-41-29 telegraf[3020]: 2019-09-24T01:17:53Z I! Starting Telegraf 1.12.1
Sep 24 01:17:53 ip-172-31-41-29 telegraf[3020]: 2019-09-24T01:17:53Z I! Loaded inputs: kernel mem processes swap system cpu disk diskio
Sep 24 01:17:53 ip-172-31-41-29 telegraf[3020]: 2019-09-24T01:17:53Z I! Loaded aggregators:
Sep 24 01:17:53 ip-172-31-41-29 telegraf[3020]: 2019-09-24T01:17:53Z I! Loaded processors:
Sep 24 01:17:53 ip-172-31-41-29 telegraf[3020]: 2019-09-24T01:17:53Z I! Loaded outputs: influxdb
Sep 24 01:17:53 ip-172-31-41-29 telegraf[3020]: 2019-09-24T01:17:53Z I! Tags enabled: host=ip-172-31-41-29
Sep 24 01:17:53 ip-172-31-41-29 telegraf[3020]: 2019-09-24T01:17:53Z I! [agent] Config: Interval:10s, Quiet:false, Hostname:"ip-172-31-41-29", Flush Interval:10s
축하합니다! Ubuntu Linux에서 Telegraf 설치를 완료했습니다.
Telegraf 구성 파일을 편집해야하는 경우이 명령을 사용하십시오.
$vi /etc/telegraf/telegraf.conf텔레그레프 속성은 아래와 같습니다.
[global_tags]
[agent]
  interval = "10s"
  round_interval = true
  metric_batch_size = 1000
  metric_buffer_limit = 10000
  collection_jitter = "0s"
  flush_interval = "10s"
  flush_jitter = "0s"
  precision = ""
  hostname = ""
  omit_hostname = false
[[outputs.influxdb]]
[[inputs.cpu]]
  percpu = true
  totalcpu = true
  collect_cpu_time = false
  report_active = false
[[inputs.disk]]
  ignore_fs = ["tmpfs", "devtmpfs", "devfs", "iso9660", "overlay", "aufs", "squashfs"]
[[inputs.diskio]]
[[inputs.kernel]]
[[inputs.mem]]
[[inputs.processes]]
[[inputs.swap]]
[[inputs.system]]
이제 설치된 로컬 Telegraf 에이전트를 원격 SNMP 장치에 연결하기위한 구성 파일을 만들어 보겠습니다.
이 예에서 원격 snmp 장치는 SNMP 서비스를 실행하는 Linux 컴퓨터 다음과 같은 구성으로 :
• 우분투 18.04
• 장치 IP 주소 : 172.31.41.29
• 장치 호스트 이름 : ip-172-31-41-29
• SNMP 커뮤니티 이름 : GokuBlack
원격 모니터링 구성 파일을 작성하여 SNMP 모니터링 기능을 사용하십시오.
vi /etc/telegraf/telegraf.d/monitor-linux-snmp.conf파일 내용은 다음과 같습니다.
[[inputs.snmp]]
  agents = [ "172.31.41.29:161"]
  version = 2
  community = "GokuBlack"
  name = "snmp"

 [[inputs.snmp.field]]
    name = "hostname"
    oid = "RFC1213-MIB::sysName.0"
    is_tag = true

  [[inputs.snmp.table]]
    name = "snmp"
    inherit_tags = [ "hostname" ]
    oid = "IF-MIB::ifXTable"

    [[inputs.snmp.table.field]]
      name = "ifName"
      oid = "IF-MIB::ifName"
      is_tag = true
환경을 반영하려면 IP 주소 172.31.41.29:161과 SNMP 커뮤니티를 변경해야합니다.
Telegraf 서비스를 다시 시작하십시오.
service telegraf restart구성 파일을 테스트하십시오.
telegraf -config /etc/telegraf/telegraf.d/monitor-linux-snmp.conf --test

> snmp,agent_host=172.31.41.29,host=ip-172-31-41-29,hostname=ip-172-31-41-29,ifName=lo ifConnectorPresent=2i,ifCounterDiscontinuityTime=0i,ifHCInBroadcastPkts=0i,ifHCInMulticastPkts=0i,ifHCInOctets=8443740i,ifHCInUcastPkts=48513i,ifHCOutBroadcastPkts=0i,ifHCOutMulticastPkts=0i,ifHCOutOctets=8443740i,ifHCOutUcastPkts=48513i,ifHighSpeed=10i,ifInBroadcastPkts=0i,ifInMulticastPkts=0i,ifOutBroadcastPkts=0i,ifOutMulticastPkts=0i,ifPromiscuousMode=2i 1569377397000000000
> snmp,agent_host=172.31.41.29,host=ip-172-31-41-29,hostname=ip-172-31-41-29,ifName=eth0 ifConnectorPresent=1i,ifCounterDiscontinuityTime=0i,ifHCInBroadcastPkts=0i,ifHCInMulticastPkts=0i,ifHCInOctets=817022623i,ifHCInUcastPkts=559533i,ifHCOutBroadcastPkts=0i,ifHCOutMulticastPkts=0i,ifHCOutOctets=10346296i,ifHCOutUcastPkts=113717i,ifHighSpeed=0i,ifInBroadcastPkts=0i,ifInMulticastPkts=0i,ifOutBroadcastPkts=0i,ifOutMulticastPkts=0i,ifPromiscuousMode=2i 1569377397000000000
Telegraf 데이터베이스에 액세스하여 시스템 모니터링이 무엇인지 확인하십시오.
> use telegraf
Using database telegraf
> show measurements
name: measurements
name
----
cpu
disk
diskio
interface
kernel
mem
processes
snmp
swap
system
As a test, select the last 2 lines of information stored on the SNMP sensor.
> select * from snmp limit 2
name: snmp
time                agent_host   host            hostname        ifConnectorPresent ifCounterDiscontinuityTime ifHCInBroadcastPkts ifHCInMulticastPkts ifHCInOctets ifHCInUcastPkts ifHCOutBroadcastPkts ifHCOutMulticastPkts ifHCOutOctets ifHCOutUcastPkts ifHighSpeed ifInBroadcastPkts ifInMulticastPkts ifName ifOutBroadcastPkts ifOutMulticastPkts ifPromiscuousMode
----                ----------   ----            --------        ------------------ -------------------------- ------------------- ------------------- ------------ --------------- -------------------- -------------------- ------------- ---------------- ----------- ----------------- ----------------- ------ ------------------ ------------------ -----------------
1569376710000000000 172.31.41.29 ip-172-31-41-29 ip-172-31-41-29 1                  0                          0                   0                   816948942    558750          0                    0                    10188182      112759           0           0                 0                 eth0   0                  0                  2
1569376710000000000 172.31.41.29 ip-172-31-41-29 ip-172-31-41-29 2                  0                          0                   0                   7370078      42778           0                    0                    7370078       42778            10          0                 0                 lo     0                  0                  2
축하합니다! Telegraf 설치가 작동 중입니다.
Grafana 모니터링 SNMP 장치
이제 Grafana와 InfluxDB 데이터베이스를 연결해야합니다.
브라우저를 열고 Grafana 서버의 IP 주소에 : 3000을 입력하십시오.
이 예에서는 브라우저에 다음 URL이 입력되었습니다.
• http://34.216.84.149:3000
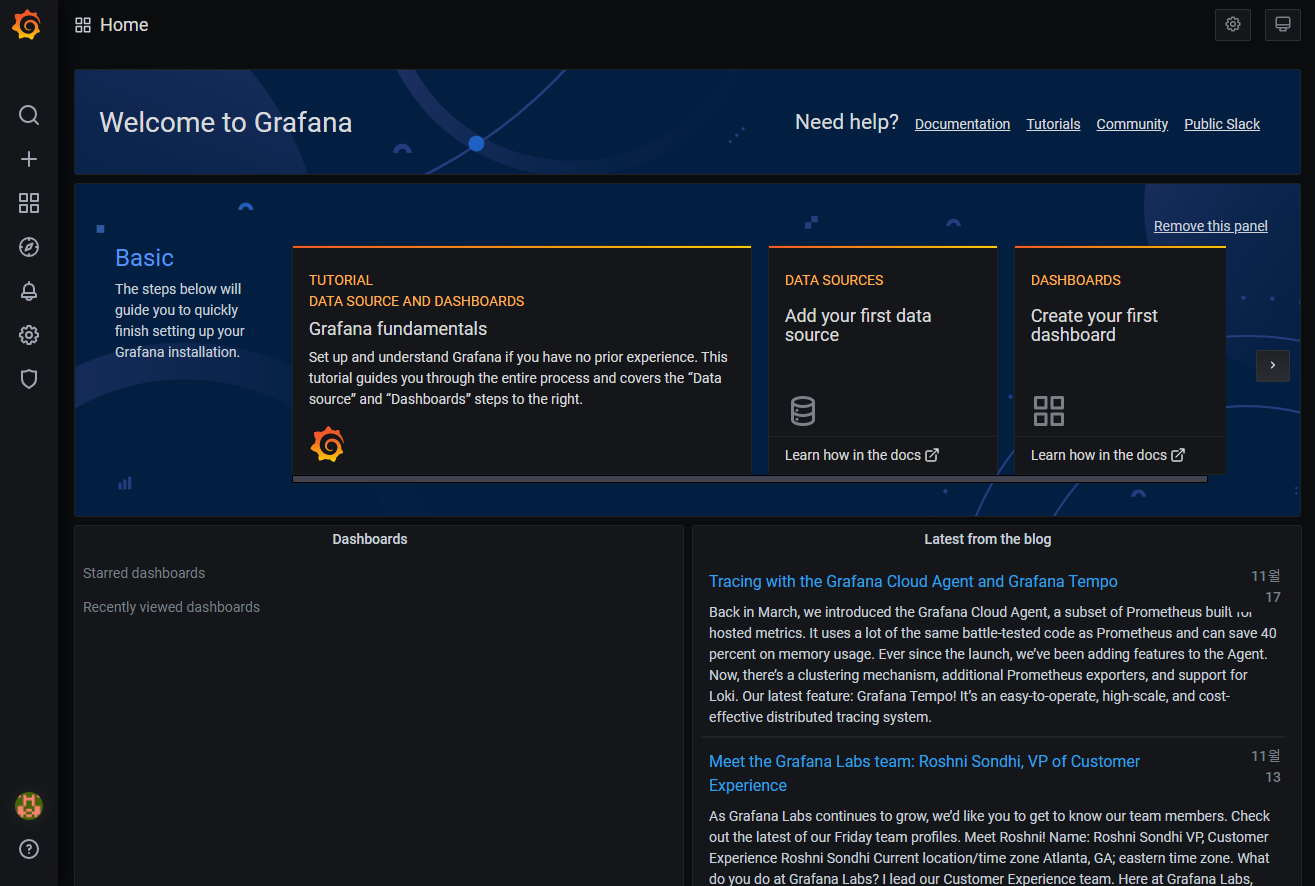
Grafana 웹 인터페이스가 제공되어야합니다.
Grafana 대시 보드에서 구성 메뉴에 액세스하고 데이터 소스 옵션을 선택하십시오.
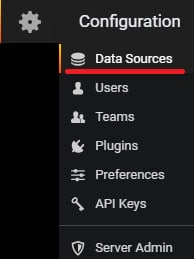
다음 데이터 소스를 추가하십시오. InfluxDB

다음 데이터 소스 구성을 수행하십시오.
• URL : http : // localhost : 8086
• 데이터베이스 : 전신
저장 및 테스트 버튼을 클릭하십시오.

Grafana 대시 보드에서 작성 메뉴에 액세스하고 대시 보드 옵션을 선택하십시오.

이 화면에서 쿼리 추가 옵션을 선택하십시오.

조회 대상으로 InfluxDB를 선택하십시오.
SNMP 장치를 모니터하기위한 조회를 작성하십시오.
다음은 네트워크 인터페이스 eth0 입력을 모니터링하기 위해 만든 쿼리 이미지입니다.

다음은 네트워크 인터페이스 eth0 출력을 모니터링하기 위해 만든 쿼리 이미지입니다.

다음은 eth0 인터페이스 입력을 모니터링하는 데 사용되는 Grafana 쿼리입니다.
SELECT non_negative_derivative(mean("ifHCInOctets"), 1s) *8 AS "In" FROM "snmp" WHERE ("hostname" = 'ip-172-31-41-29' AND "ifName" = 'eth0') AND $timeFilter GROUP BY time($__interval), "hostname", "ifName" fill(null)다음은 eth0 인터페이스 출력을 모니터링하는 데 사용되는 Grafana 쿼리입니다.
SELECT non_negative_derivative(mean("ifHCOutOctets"), 1s) *8 AS "Out" FROM "snmp" WHERE ("hostname" = 'ip-172-31-41-29' AND "ifName" = 'eth0') AND $timeFilter GROUP BY time($__interval), "hostname", "ifName" fill(null)
시각화 메뉴에 액세스하고 축 단위를 비트 / 초로 변경하십시오.
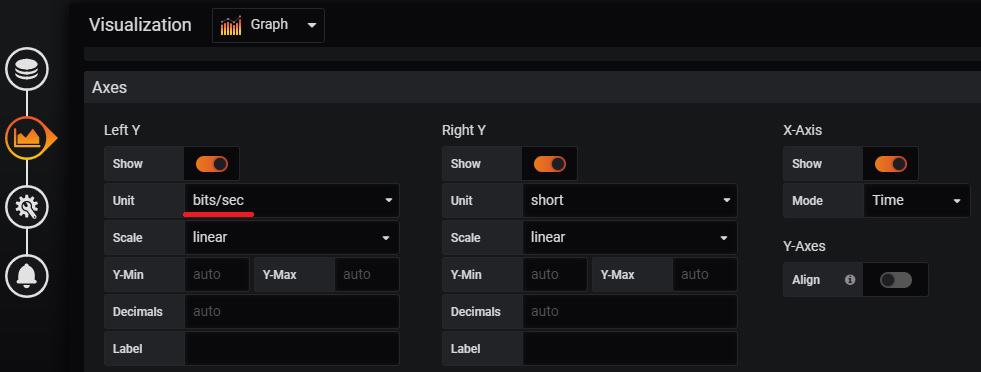
대시 보드를 저장하고 대시 보드 홈 메뉴로 돌아갑니다.
작성한 대시 보드 이름을 선택하십시오.
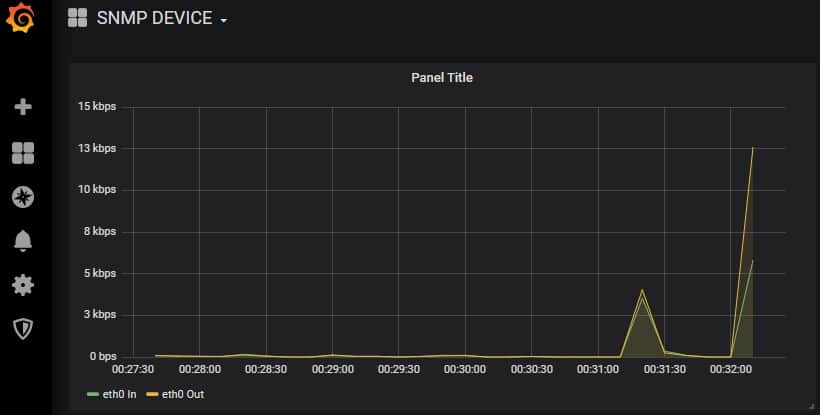
축하합니다! Grafana를 사용하여 snmp 장치를 모니터링 할 수 있습니다.
- Total
- Today
- Yesterday
- 설치하기(HP-UX)
- 앤시블
- 버쳐박스
- 트리이스
- startup 에러
- CVE 취약점 점검
- [오라클 튜닝] sql 튜닝
- 테라폼
- MSA
- pod 상태
- 우분투
- 쿠버네티스
- [오라클 튜닝] instance 튜닝2
- Oracle
- 스토리지 클레스
- 오라클 홈디렉토리 copy 후 startup 에러
- 커널
- directory copy 후 startup 에러
- 여러서버 컨트롤
- 오라클 트러블 슈팅(성능 고도화 원리와 해법!)
- ORACLE 트러블 슈팅(성능 고도화 원리와 해법!)
- (InstantClient) 설치하기(HP-UX)
- 오라클 인스턴트클라이언트(InstantClient) 설치하기(HP-UX)
- K8s
- 키알리
- 5.4.0.1072
- 튜닝
- ubuntu
- 오라클
- 코로나19
| 일 | 월 | 화 | 수 | 목 | 금 | 토 |
|---|---|---|---|---|---|---|
| 1 | 2 | 3 | 4 | 5 | 6 | 7 |
| 8 | 9 | 10 | 11 | 12 | 13 | 14 |
| 15 | 16 | 17 | 18 | 19 | 20 | 21 |
| 22 | 23 | 24 | 25 | 26 | 27 | 28 |
| 29 | 30 |