
티스토리 뷰
https://cortexmetrics.io/docs/architecture/
Cortex Architecture
Cortex consists of multiple horizontally scalable microservices. Each microservice uses the most appropriate technique for horizontal scaling; most are stateless and can handle requests for any users while some (namely the ingesters) are semi-stateful and
cortexmetrics.io

# 사전에 GOlang 부터 설치 해야 합니다.
#apt install golang-go # version 2:1.13~1ubuntu2
#apt install gccgo-go # version 2:1.13~1ubuntu2
#snap install go # version 1.20.3, or
(admin-k8s:awx) root@k8s-m:/home/prometheus# apt  install golang-go
Reading package lists... Done
Building dependency tree
Reading state information... Done
The following packages were automatically installed and are no longer required:
  ieee-data python3-argcomplete python3-dnspython python3-libcloud python3-lockfile
  python3-netaddr python3-selinux
Use 'apt autoremove' to remove them.
The following additional packages will be installed:
  golang-1.13-go golang-1.13-race-detector-runtime golang-1.13-src
  golang-race-detector-runtime golang-src pkg-config
Suggested packages:
  bzr | brz mercurial subversion
The following NEW packages will be installed:
  golang-1.13-go golang-1.13-race-detector-runtime golang-1.13-src golang-go
  golang-race-detector-runtime golang-src pkg-config
0 upgraded, 7 newly installed, 0 to remove and 27 not upgraded.
Need to get 61.0 MB of archives.
After this operation, 324 MB of additional disk space will be used.
Do you want to continue? [Y/n]
# Golang 설치 중입니다.

#프로메테우스 설치 하기
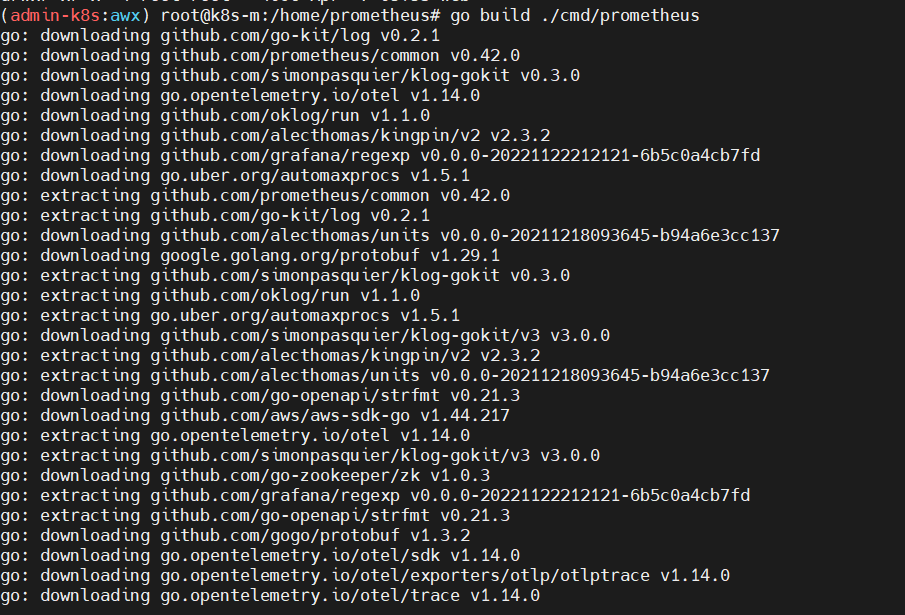
$ git clone https://github.com/prometheus/prometheus
$ cd prometheus
$ go build ./cmd/prometheus#프로메테우스 설치중입니다.
#git clone https://github.com/cortexproject/cortex.git
#Cortex 설치 하기
$ git clone https://github.com/prometheus/prometheus
$ cd cortex
$ go build ./cmd/cortex
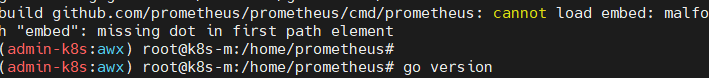
$ ./cortex -config.file=./docs/configuration/single-process-config-blocks-local.yaml오픈소스 : golang 버전업해야 한다는 메세지
https://keepdev.tistory.com/66
Ubuntu 20.04 LTS에 Golang 최신버전 설치하기
1. 첫 번째 방법 - 실패 sudo apt install go 설치는 잘 되고, 알아서 환경변수 설정되 되었지만, 최신버전이 설치가 되지 않았다. apt를 업데이트 해도 계속 이전 버전이 설치가 되어서, 결국 이렇게 설
keepdev.tistory.com
방법
update golang이라는 github repo를 확인하고, 방법을 적용하였다.
해당 글은 update golang이라고 나와있지만, latest golang을 설치하는 것 또한 동일하다.
git clone https://github.com/udhos/update-golang
cd update-golang
sudo ./update-golang.sh
이렇게 위 REPO에서 update-golang.sh 파일을 받아서 실행해주면 최신버전 go가 잘 깔린다!
환경변수는 따로 설정해줘야 하는데, 이렇게 설치한 go의 경로는 아래와 같다.
/usr/local/go
환경변수를 설정할 때는, /usr/local/go/bin 의 bin 디렉토리로 설정해줘야 하므로, 아래와 같이 echo를 이용해 .zshrc 파일에 환경변수를 추가해줬다. (환경변수 추가 방법)
sudo echo 'export PATH=$PATH:/usr/local/go/bin' >> ~/.zshrc
여기서 주의할 것은, 나는 zsh를 사용하기 때문에 ~/.zshrc지만, 다른 shell을 사용한다면 해당하는 shell rc 파일이나 profile 파일에 환경변수를 추가하면 된다!
(admin-k8s:awx) root@k8s-m:/home# git clone https://github.com/cortexproject/cortex.git
Cloning into 'cortex'...
remote: Enumerating objects: 139733, done.
remote: Counting objects: 100% (1417/1417), done.
remote: Compressing objects: 100% (251/251), done.
remote: Total 139733 (delta 695), reused 1366 (delta 653), pack-reused 138316
Receiving objects: 100% (139733/139733), 156.08 MiB | 11.09 MiB/s, done.
Resolving deltas:  33% (28992/86620)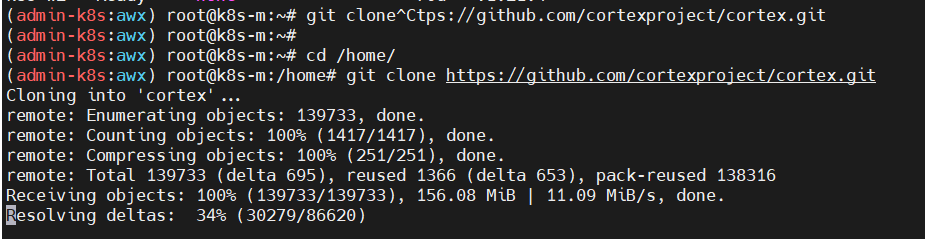
참고 URL
https://blog.outsider.ne.kr/1429
Cortex: Prometheus-as-a-Service :: Outsider's Dev Story
지금 참여하고 있는 인프라 스터디에서 [책도 보고 있지만](https://blog.outsider.ne.kr/1428) 동시에 [CNCF](https://www.cncf.io/)에서 [지원하는 프로젝트](https://www.cncf.io/projects/)도 하나씩 살펴보...
blog.outsider.ne.kr

Cortex 저장소에 가면 Prometheus-as-a-Service라고 설명하고 있다. 즉, Prometheus를 서비스로 제공하기 위한 프로젝트라는 의미이다.
1. Prometheus가 보통 한 서버에서 메트릭을 저장하게 되어 있고 샤딩 기반의 확장만 지원
2. Cortex를 쓰면 수평적 확장을 지원하고 단기간만 메트릭을 저장하는 게 아니라 롱텀 스토리지로 데이터를 오랫동안 보관하고 멀티 테넌트, 즉 여러 서비스나 사용자가 메트릭을 따로 저장하고 관리할 수 있도록 한다는 뜻
3. Prometheus 호환 쿼리 API를 지원하므로 수평적 확장을 통해서 메트릭을 읽어오는 것도 가능.
Cortex 아키텍처
GitHub - cortexproject/cortex: A horizontally scalable, highly available, multi-tenant, long term Prometheus.
A horizontally scalable, highly available, multi-tenant, long term Prometheus. - GitHub - cortexproject/cortex: A horizontally scalable, highly available, multi-tenant, long term Prometheus.
github.com
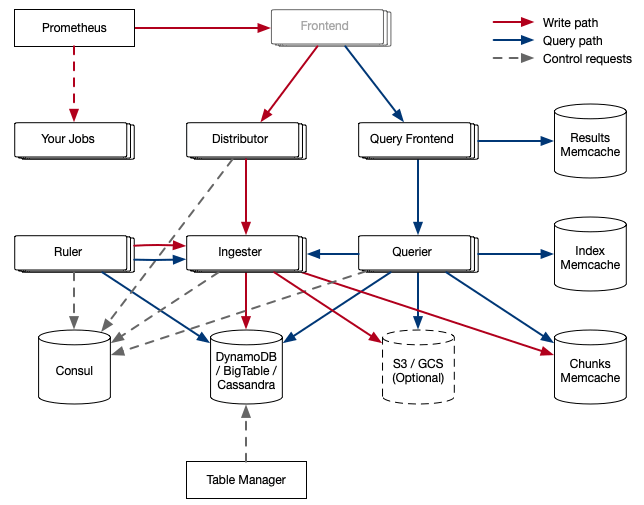
위 구조에서 Prometheus와 Your Jobs라고 된 부분은 Cortex의 구조에는 안 들어간다. 메트릭을 수집한 Promethues에서 remote_write로 Cortex에 메트릭을 보내는 것을 나타낸 것이다. Frontend라고 된 부분은 회색으로 음역처리가 되어 있는데 Cortex를 좀 띄워 봤을 때는 Cortex 자체의 구성 요소라기보다는 앞에서 nginx같은 웹서버로 라우팅하므로 진입점이라는 의미로 그린 것 같다.
각 구성 요소를 살펴보자. 위 그림과 각 구성 요소의 역할을 같이 보면 이해하기가 좀 쉽다.
- Prometheus
1. 메트릭을 수집해서 Cortex에 넣는 역할을 하는데 이때 remote write API를 사용
2. remote write API는 Snappy로 압축된 Protocol Buffer 메시지를 HTTP PUT 요청을 배치
3. 쓰기 요청은 Distributor가 받고 PromQL 쿼리를 이용한 읽기 요청은 Query Frontend가 받음
- Distributor
1. Prometheus가 보낸 메트릭을 처리하고 gRPC로 ingester와 통신한다.
2. 상태가 없으므로 필요에 따라 확장할 수 있다.
3. consistent hash ring를 이용해서 어떤 ingester가 메트릭 데이터를 받을지를 결정하고 이 consistent hash ring은 Consul에 저장된다.
3. hash ring 데이터 구조를 Protobuf 메시지로 인코딩된다. - Ingester
1. DynamoDB, BigTable, S3, Cassandra 같은 롱텀 스토리지 백엔드에 데이터를 저장하는 역할을 한다.
2. Ingester는 아무것도 공유하지 않고 데이터를 처리한다.(shared-noting process)
3. 약간의 상태를 가지는데 최신 12시간의 메트릭을 유지하고 있으므로 재시작할 때는 데이터를 잃지 않게 조심해야 한다. - Ruler
1. alertmanager가 만든 알림을 다룬다.(이번에 살펴볼 때는 자세히 보지 않았다.)
2. Query Frontend
3. Query Frontend는 PromQL로 remote_read를 사용할 때만 띄우면 되고 Cortex 구성에서 반드시 띄워야 하는 것은 아니다.
4. Queuing을 통해 실제 쿼리를 실행하는 Querier가 대형 쿼리를 실행하다가 Out Of Memory를 일으킬 때를 위해 재시도를 보장하고 쿼리를 FIFO로 분산해서 한 Querier가 대형 쿼리를 다수 받지 않도록 하며 서비스 사용자(tenant)가 쿼리를 공정하게 스케줄링해서 DoS에서 사용자를 보호한다.
5. Splitting을 통해 여러 날짜에 걸치 쿼리를 하루짜리 다수의 쿼리로 나누어서 Querier로 보내고 결과를 받아서 다시 합친다.
6. 쿼리 결과를 캐싱하고 이를 재사용한다. - Querier
1. 롱텀 스토리지에 저장된 데이터에서 실제 PromQL 평가를 처리한다. - Chunk Store
1. Cortex의 롱텀 데이터 스토어다.
데모 실행
1.Kuberntes로 쉽게 Cortex 환경을 구성할 수 있도록 제공
2. Cortex 저장소를 클론 받으면 실행해 볼 수 있도록 k8s 디렉터리가 있다. 이 Kubernetes 설정에서 사용하는 이미지는 Quay의 이미지를 사용하는데 지정된 latest 이미지는 없으므로 로컬에서 생성해야 한다. 저장소를 클론 받아서 make 명령어를 실행하면 로컬에 이미지가 만들어진다.
$ kubectl create -f ./k8s

deployment.extensions "alertmanager" created
service "alertmanager" created
deployment.extensions "configs-db" created
service "configs-db" created
deployment.extensions "configs" created
service "configs" created
deployment.extensions "consul" created
service "consul" created
deployment.extensions "distributor" created
service "distributor" created
deployment.extensions "dynamodb" created
service "dynamodb" created
deployment.extensions "ingester" created
service "ingester" created
deployment.extensions "memcached" created
service "memcached" created
configmap "nginx" created
deployment.extensions "nginx" created
service "nginx" created
deployment.extensions "querier" created
service "querier" created
deployment.extensions "query-frontend" created
service "query-frontend" created
configmap "retrieval-config" created
deployment.extensions "retrieval" created
service "retrieval" created
deployment.extensions "ruler" created
service "ruler" created
deployment.extensions "s3" created
service "s3" created
deployment.extensions "table-manager" created
service "table-manager" created
이는 Cortex 개발용 환경으로 필요한 모든 구성이 실행된다.(앞에서 말했듯이 프로덕션용 설정 문서는 찾지 못했다.)
$ kubectl get all
NAME                                  READY     STATUS    RESTARTS   AGE
pod/alertmanager-54d9cfd844-z7jnv     1/1       Running   0          7m
pod/configs-84ff5785c-9kldc           1/1       Running   0          7m
pod/configs-db-5f9b64f5cc-wwx48       1/1       Running   0          7m
pod/consul-5c4f79cf47-flmsb           1/1       Running   0          7m
pod/distributor-6b58d9986-hv5nj       1/1       Running   0          7m
pod/dynamodb-68fc4457c6-9c7pq         1/1       Running   0          7m
pod/ingester-7b7b9f8f84-2dftc         1/1       Running   0          7m
pod/memcached-f99cdf957-cdgbq         1/1       Running   0          7m
pod/nginx-7856cc488b-vnk4l            1/1       Running   1          7m
pod/querier-58646d4dc9-vsrg8          1/1       Running   0          7m
pod/query-frontend-59dbb8dd95-x29sg   1/1       Running   0          7m
pod/retrieval-69bd8bdd88-xwc9d        1/1       Running   0          7m
pod/ruler-6fbbb9998b-vdjhg            1/1       Running   0          7m
pod/s3-57dc56ffb4-tl2hp               1/1       Running   0          7m
pod/table-manager-5b474f6685-ll5l8    1/1       Running   0          7m

NAME                     TYPE        CLUSTER-IP       EXTERNAL-IP   PORT(S)              AGE
service/alertmanager     ClusterIP   10.99.21.8       <none>        80/TCP               7m
service/configs          ClusterIP   10.109.200.199   <none>        80/TCP               7m
service/configs-db       ClusterIP   10.108.43.242    <none>        5432/TCP             7m
service/consul           ClusterIP   10.104.52.73     <none>        8500/TCP             7m
service/distributor      ClusterIP   10.102.76.244    <none>        80/TCP               7m
service/dynamodb         ClusterIP   10.101.128.11    <none>        8000/TCP             7m
service/ingester         ClusterIP   10.109.232.228   <none>        80/TCP               7m
service/kubernetes       ClusterIP   10.96.0.1        <none>        443/TCP              6d
service/memcached        ClusterIP   None             <none>        11211/TCP,9150/TCP   7m
service/nginx            NodePort    10.100.221.142   <none>        80:30080/TCP         7m
service/querier          ClusterIP   10.97.68.116     <none>        80/TCP               7m
service/query-frontend   ClusterIP   None             <none>        9095/TCP,80/TCP      7m
service/retrieval        ClusterIP   10.102.125.39    <none>        80/TCP               7m
service/ruler            ClusterIP   10.111.194.194   <none>        80/TCP               7m
service/s3               ClusterIP   10.102.240.155   <none>        4569/TCP             7m
service/table-manager    ClusterIP   10.107.78.253    <none>        80/TCP               7m

NAME                             DESIRED   CURRENT   UP-TO-DATE   AVAILABLE   AGE
deployment.apps/alertmanager     1         1         1            1           7m
deployment.apps/configs          1         1         1            1           7m
deployment.apps/configs-db       1         1         1            1           7m
deployment.apps/consul           1         1         1            1           7m
deployment.apps/distributor      1         1         1            1           7m
deployment.apps/dynamodb         1         1         1            1           7m
deployment.apps/ingester         1         1         1            0           7m
deployment.apps/memcached        1         1         1            1           7m
deployment.apps/nginx            1         1         1            1           7m
deployment.apps/querier          1         1         1            1           7m
deployment.apps/query-frontend   1         1         1            1           7m
deployment.apps/retrieval        1         1         1            1           7m
deployment.apps/ruler            1         1         1            1           7m
deployment.apps/s3               1         1         1            1           7m
deployment.apps/table-manager    1         1         1            1           7m

NAME                                        DESIRED   CURRENT   READY     AGE
replicaset.apps/alertmanager-54d9cfd844     1         1         1         7m
replicaset.apps/configs-84ff5785c           1         1         1         7m
replicaset.apps/configs-db-5f9b64f5cc       1         1         1         7m
replicaset.apps/consul-5c4f79cf47           1         1         1         7m
replicaset.apps/distributor-6b58d9986       1         1         1         7m
replicaset.apps/dynamodb-68fc4457c6         1         1         1         7m
replicaset.apps/ingester-7b7b9f8f84         1         1         1         7m
replicaset.apps/memcached-f99cdf957         1         1         1         7m
replicaset.apps/nginx-7856cc488b            1         1         1         7m
replicaset.apps/querier-58646d4dc9          1         1         1         7m
replicaset.apps/query-frontend-59dbb8dd95   1         1         1         7m
replicaset.apps/retrieval-69bd8bdd88        1         1         1         7m
replicaset.apps/ruler-6fbbb9998b            1         1         1         7m
replicaset.apps/s3-57dc56ffb4               1         1         1         7m
replicaset.apps/table-manager-5b474f6685    1         1         1         7m
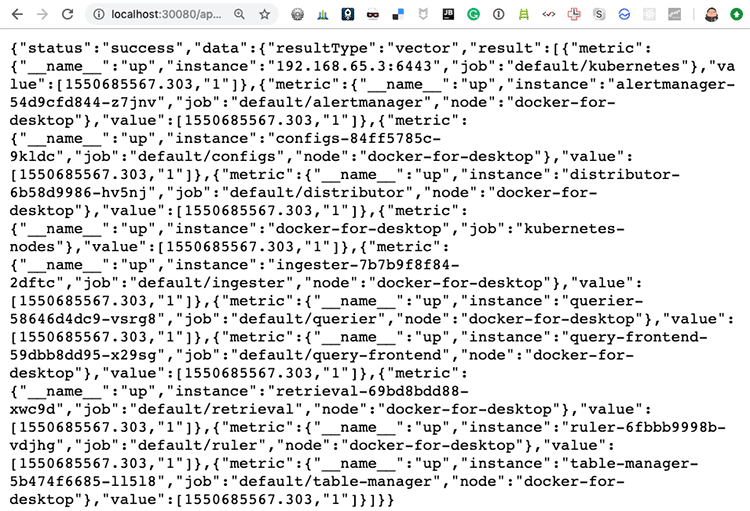
개발용이라 상당히 많은 서비스가 실행된다. 앞에 아키텍처 구성과 같이 보면 어떤 서비스가 실행되었는지 알 수 있고 dynamodb나 s3 같은 건 로컬에서 테스트해볼 수 있는 이미지들이다. http://localhost:30080/api/prom/api/v1/query?query=up에 접속해 보면 Query Frontend에 접속해서 PromQL 쿼리를 실행해 볼 수 있다. 여기서는 Cortex에서 실행된 서버(up)를 조회한 것이다.
여기에 Grafana를 연동해서 확인해 볼 수 있는데 Cortex에서 Grafana의 대시보드 설정을 생성할 수 있도록 이미 제공하고 있다. 로컬에 데이터 템플릿 언어인 Jsonnet을 설치하고 Grafonnet을 클론 받는다. 앞에서 클론 받은 Cortex 디렉터리에서 docs/dashboards에 들어가서 아래 명령어를 실행한다.
Grafana: The open observability platform | Grafana Labs
Your observability stack Operational dashboards for your data here, there, or anywhere
grafana.com
GitHub - grafana/grafonnet-lib: Jsonnet library for generating Grafana dashboard files.
Jsonnet library for generating Grafana dashboard files. - GitHub - grafana/grafonnet-lib: Jsonnet library for generating Grafana dashboard files.
github.com
Jsonnet - The Data Templating Language
A data templating language for app and tool developers Generate config data Side-effect free Organize, simplify, unify Manage sprawling config
jsonnet.org
GitHub - cortexproject/cortex: A horizontally scalable, highly available, multi-tenant, long term Prometheus.
A horizontally scalable, highly available, multi-tenant, long term Prometheus. - GitHub - cortexproject/cortex: A horizontally scalable, highly available, multi-tenant, long term Prometheus.
github.com
$ jsonnet -J ../../grafonnet-lib/ -o cortex-read.json cortex-read.jsonnet
$ jsonnet -J ../../grafonnet-lib/ -o cortex-write.json cortex-write.jsonnet
여기서 ../../grafonnet-lib/는 앞에서 Grafonnet을 클론 받은 디렉터리의 위치이다. 이 두 명령어를 실행하면 cortex-read.json, cortex-write.json 파일이 생성된다. 이 파일은 Grafana 대시보드에서 불러올 수 있는 설정 파일이라고 생각하는데 Jsonnet을 처음 써봐서 자세한 파일의 내용은 모르는 상태이다.
$ docker run -d -p 3000:3000 grafana/grafana
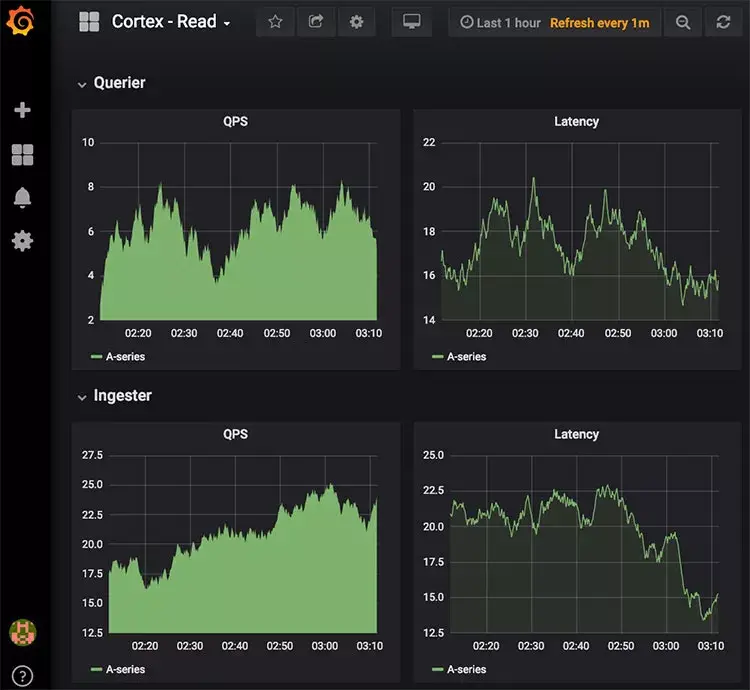
위 명령어로 Grafana를 실행하고 http://localhost:3000에 접속하면 Grafana에 접속할 수 있다.(초기 로그인 정보는 admin/admin이다.) 접속한 후 Import로 앞에서 생성한 cortex-read.json, cortex-write.json를 불러오면 다음과 같이 바로 대시보드가 생성되고 Cortex의 매트릭을 볼 수 있다. 이 JSON 파일의 구조까지는 몰라서 바로 실행했는데 이전 시간의 매트릭정보까지 나오는 이유는 잘 모르겠다. 여기서는 Cortext의 동작을 보는 것이므로 그냥 넘어갔다.
k8s/nginx-config.yaml 파일의 내용을 보면 Cortex가 정보를 받는 라우팅 경로를 볼 수 있다.
location = /api/prom/push {
  proxy_pass      http://distributor.default.svc.cluster.local$request_uri;
}

location ~ /api/prom/.* {
  proxy_pass      http://query-frontend.default.svc.cluster.local$request_uri;
}
/api/prom/push는 메트릭을 저장하는 Distributor로 보내는 경로이고 그 외 /api/prom/.*로 들어오는 요청은 Query Frontend로 전달된다.
이제 Cortex를 실행했는데 Cortex 자체가 Prometheus의 매트릭을 저장하는 역할이므로 Prometheus가 있어야 동작 여부를 제대로 확인할 수 있다. 다음과 같이 prometheus.yml 설정 파일을 생성한다. 이는 기본적인 Promethus 설정 파일이다.
# my global config
global:
  scrape_interval:     15s # Set the scrape interval to every 15 seconds. Default is every 1 minute.
  evaluation_interval: 15s # Evaluate rules every 15 seconds. The default is every 1 minute.
  # scrape_timeout is set to the global default (10s).

# Alertmanager configuration
alerting:
  alertmanagers:
  - static_configs:
    - targets:
      # - alertmanager:9093

# Load rules once and periodically evaluate them according to the global 'evaluation_interval'.
rule_files:
  # - "first_rules.yml"
  # - "second_rules.yml"

# A scrape configuration containing exactly one endpoint to scrape:
# Here it's Prometheus itself.
scrape_configs:
  # The job name is added as a label `job=<job_name>` to any timeseries scraped from this config.
  - job_name: 'prometheus'

    # metrics_path defaults to '/metrics'
    # scheme defaults to 'http'.

    static_configs:
    - targets: ['localhost:9090']

# Settings related to the remote write feature.
remote_write:
  - url: "http://localhost:30080/api/prom/push"
맨 마지막을 보면 remote_write에서 Cortext에 원격 쓰기를 하도록 설정한 것을 볼 수 있다.
$ ./prometheus --config.file=prometheus.yml
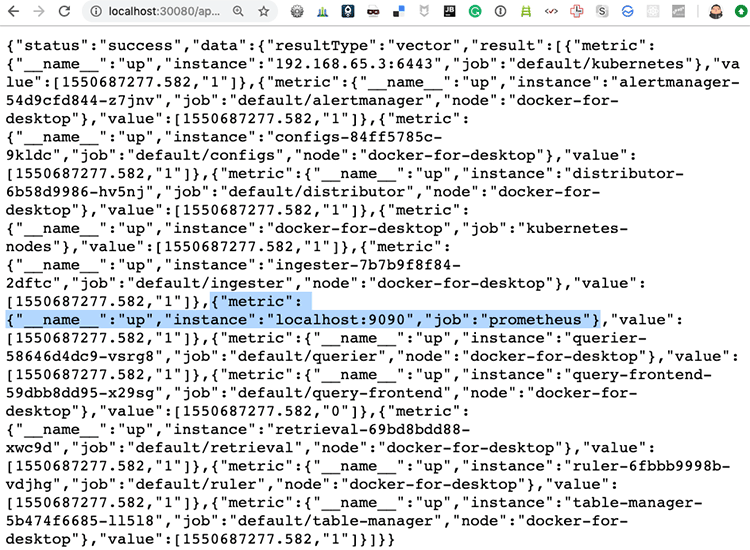
Prometheus를 로컬에 설치하고 위의 설정 파일로 실행하면 http://localhost:9090에 접속해서 확인해 볼 수 있다. remote_write를 설정했으므로 다시 Cortex의 Query Frontend인 http://localhost:30080/api/prom/api/v1/query?query=up에 접속해서 확인해 보면 방금 실행한 http://localhost:9090가 추가된 것을 볼 수 있다. 이는 앞에서 실행했을 때는 없던 메트릭 정보이다.
동작을 다시 설명하면 Prometheus가 자신이 수집한 메트릭 정보를 remote_write로 Cortex에 저장하고 이를 조회한 것이다.
앞에서 작성한 prometheus.yml 파일에 아래의 remote_read 설정을 추가해 보자.
# Settings related to the remote read feature.
remote_read:
  - url: "http://localhost:30080/api/prom/read"
    read_recent: true
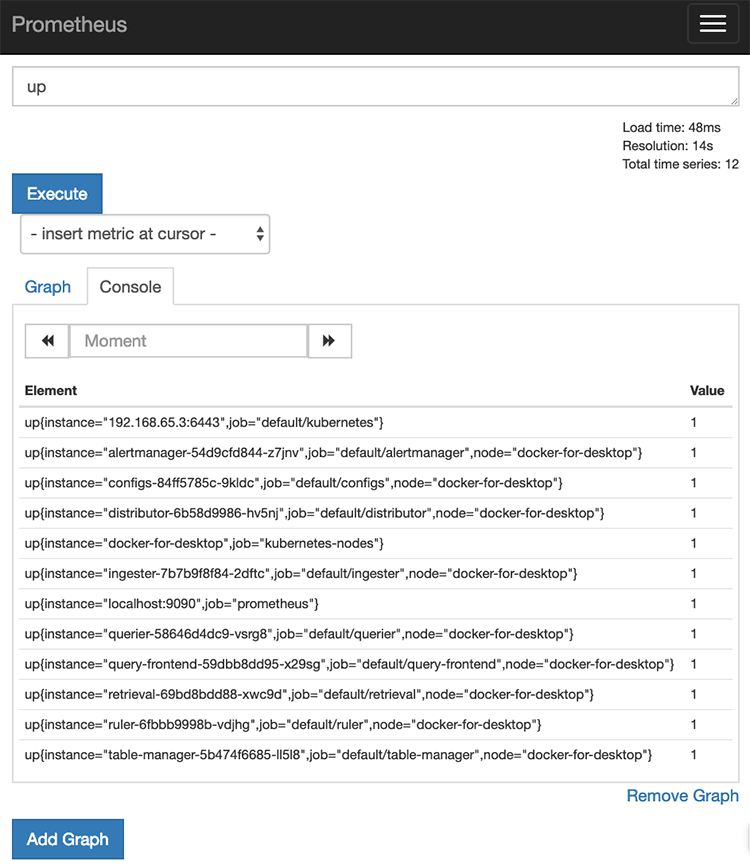
이 설정으로 Prometheus를 다시 실행하고 http://localhost:9090에 접속해서 up 인스턴스를 조회하면 다음과 같이 Prometheus뿐만 아니라 Cortex에 저장되어 있던 메트릭 정보도 같이 조회되는 것을 확인할 수 있다.
앞에서 설명한 데로 remote_write로 메트릭을 Cortex에 장기로 저장해서 사용할 수도 있는데 Prometheus에서 메트릭 정보를 너무 많이 저장해서 보관할 수는 없으므로 Cortex를 remote_read로 설정하면 Prometheus에서 조회할 때도 Cortex의 정보를 같이 조회해서 보여준다.
이렇게 설정해서 사용한다면 Prometheus에는 필요한 짧은 기간의 메트릭 정보만 보관하면서 사용하다가 긴 기간의 데이터를 조회할 때는 Cortex에서 불러오도록 해서 사용할 수 있다.
- 2019/02/21 04:05
- Infrastructure
- Cortex, metric, monitoring, prometheus, PromQL, weaveworks, 모니터링

-
Trackback URL : 이 글에는 트랙백을 보낼 수 없습니다
- Total
- Today
- Yesterday
- 설치하기(HP-UX)
- [오라클 튜닝] instance 튜닝2
- 오라클 홈디렉토리 copy 후 startup 에러
- [오라클 튜닝] sql 튜닝
- CVE 취약점 점검
- 트리이스
- 키알리
- pod 상태
- ORACLE 트러블 슈팅(성능 고도화 원리와 해법!)
- directory copy 후 startup 에러
- 앤시블
- MSA
- startup 에러
- 버쳐박스
- 튜닝
- 코로나19
- 오라클 트러블 슈팅(성능 고도화 원리와 해법!)
- K8s
- 오라클 인스턴트클라이언트(InstantClient) 설치하기(HP-UX)
- 커널
- 여러서버 컨트롤
- ubuntu
- 스토리지 클레스
- 우분투
- 테라폼
- Oracle
- (InstantClient) 설치하기(HP-UX)
- 5.4.0.1072
- 쿠버네티스
- 오라클
| 일 | 월 | 화 | 수 | 목 | 금 | 토 |
|---|---|---|---|---|---|---|
| 1 | 2 | 3 | 4 | 5 | 6 | 7 |
| 8 | 9 | 10 | 11 | 12 | 13 | 14 |
| 15 | 16 | 17 | 18 | 19 | 20 | 21 |
| 22 | 23 | 24 | 25 | 26 | 27 | 28 |
| 29 | 30 |